730-F22 Week 2: Changing the graph paper
The key idea: if we had the "right graph paper", then the relations between phonological categories would be "simpler"---we'd reveal systematic patterns that wouldn't otherwise be as apparent if we had a less-optimal graph paper for understanding how the categories lie in space.
We can then understand the relations between the categories better, get a better grip on what is going on, with our tiny brains
Whether or not, say, a listener also then "uses this graph paper" is another question (but I think we intuitively think that if we find a simple relation, then that would be more likely one that the listener/cognitive system uses)
- See among others, work by Barreda on perceptual validation
Warm-ups
Teaser visualizations:
Transformations of the number line: see also text/video from Khan academy
Scaling graph paper demo vs. scaling functions
- What do we mean by changing the graph paper? Follow a vector!
- Functions as transformations Sinusoidal demo: following points
Transformations in 2D: follow a point and see text/video from Khan academy
Exercises with physical graph paper (yes! real paper) generated from https://incompetech.com/graphpaper
Polar coordinates and sinusoids
Asymmetric scaling: what happens to rectangles? (teaser for next week and Mahalanobis distance!)
Logarithmic scaling: what do we mean by logs "turn multiplication into addition"?
Multiplicative between-speaker relationships: Barreda 2022 p. 2-4
The uniform scaling hypothesis (also known as the constant ratio hypothesis) is one of the earliest attempts to explain phone-preserving variation in formant patterns, its general outlines being sug- gested at least as far back as Lloyd 1890. The uniform scaling hypothesis states that the perceived quality of vowel sounds is more likely to be maintained when variation in formant patterns is according to a single scaling parameter, relative to uncoordinated changes to individual formant frequencies.
Variation of formant patterns according to a single spectral-scaling parameter (i.e. uniform scaling) results in spectra that differ in the expansion or contraction of a fixed pattern along the frequency axis, as in Figure 2a. Another way to look at this is that a single vowel quality can be associated with spectra differing in their ‘size’ expansion along the frequency axis, so long as their general, underlying spectral ‘shape’ is preserved (Irino & Patterson 2002).
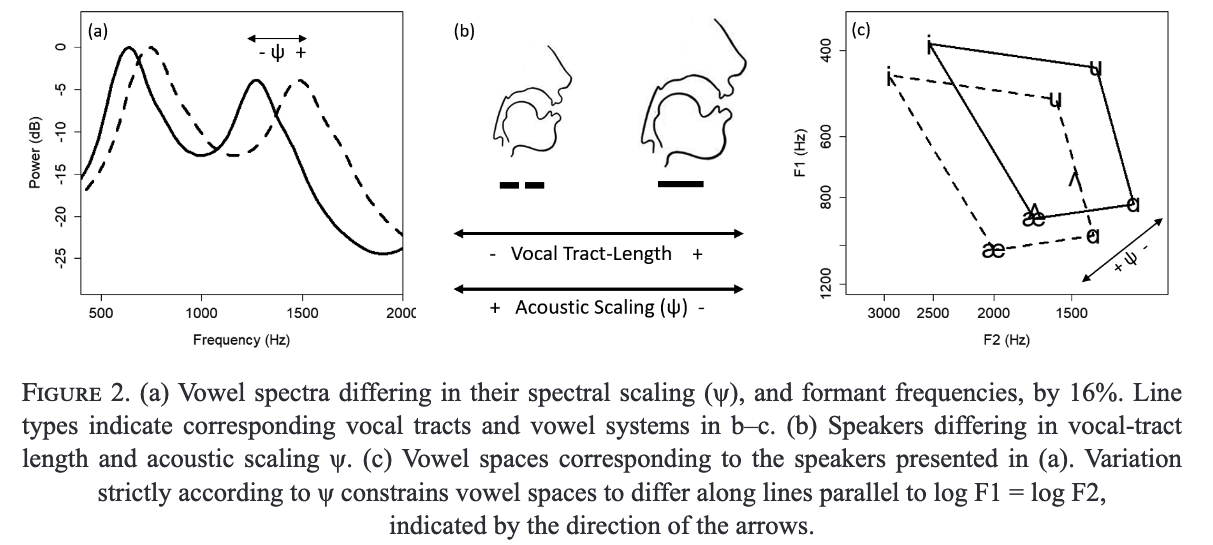
Here, between-speaker variation in ψ is discussed directly in terms of proportional differences in expected formant frequencies, so if the ψs of one speaker is 10% higher than that of another, the first speaker is expected to produce formants that are 10% higher overall than those of the second speaker for any given vowel phoneme.
The uniform scaling hypothesis does not imply that all between-speaker variation in formant patterns for a phoneme should be according to uniform scaling, but rather that these differences are most likely to preserve vowel quality.
Changing the graph paper: exercise from Mark Liberman COGS501
- See R notebook
730-f22-graph-paper-exploration.Rmd. - Acoustic, "data-analytic" approach
What's the clock? Does the clock vary?
Absolute time, e.g., in ms, like a constant sampling rate over all utterances, not conditioned on any factors, no change over different domains
"Phonological" time, e.g., segment out phonological units like the onset, rime, nucleus, segments, etc.
Then "normalize" over the phonological unit! (typically linear -> see Praat demo)
Constant sampling rate over each phonological unit across some population of utterances, e.g., across speakers, across tones, etc.
- (Then what happens to absolute duration as a piece of information? We'll see later that you can add this information in separately in regressions...but is that sufficient for modeling what's happening?)
Perceptual motivation for clock choices
See for instance some chapters in recently released Prosodic Theory and Practice
Schweitzer et al. (2022) on two different time normalization procedures for their "pitch stylization" algorithm
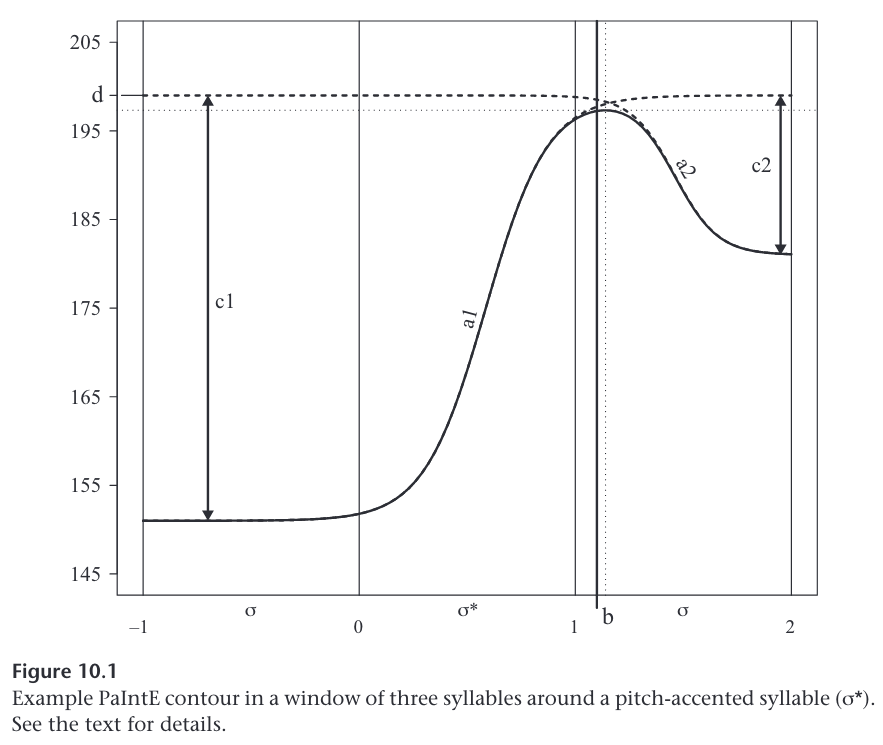
PaIntE provides several methods to normalize the time axis. In the standard variant, which is called sylnorm normalization, the time axis inside the approximation window is normalized such that syllable boundaries occur at integer values, with the syllable related to the intonation event beginning at 0 and ending at 1. In the sylnorm case, b determines the temporal alignment of the peak in terms of relative position within the syllables in the approximation window. A hypothetical example peak contour for a syllable associated with a pitch accent, using sylnorm normalization, is given in figure 10.1. (p. 354-355)
So far we have discussed only the application of PaIntE using the sylnorm normalization; however, PaIntE also provides an alternative called anchor normalization. In this case, each syllable is split into three parts representing the (unvoiced) onset of the syllable; its sonorant nucleus, which is defined as containing the nucleus and possibly preceding voiced consonants in the onset; and, finally, the coda. This normalization is motivated by findings that indicate that timing in F0 movements is relative to syllable structure (House 1996, 1997; van Santen and Möbius 2000). Using anchor normalization, each syllable in the approximation window is again normalized to length one with the same values for syllable boundaries as in the sylnorm case. Syllable-internally, the unvoiced onset is adjusted linearly to a length of 30 percent of the syllable duration. The sonorant nucleus then spans another 50 percent: it ranges from 30 to 80 percent of the syllable duration, and the coda finally goes from 80 to 100 percent of the syllable duration. (Schweitzer et al. 2022, p. 356-357)
- Mertens p. 263 on spectral instability
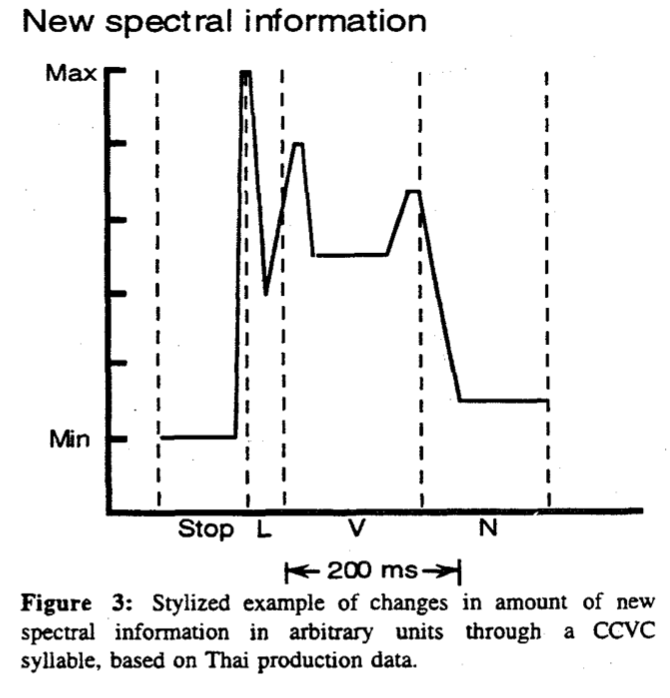
Spectral instability and its impact on pitch perception. Spectral change and amplitude drop at the transition between sounds (consonants and vowels) can perceptually mask F0 change during this transition (’t Hart, Collier, and Cohen 1990, 36). Experiments by House (1990) show that an F0 variation—for instance, a linear rise of fixed duration and size—is perceived differently, as either a pitch movement or an abrupt change of pitch, depending on its location relative to the vowel onset in the syllable. This phenomenon (known as the spectral stability hypothesis) is attributed to spectral change at the transition between sounds, which lowers sensitivity to pitch change. The amount of spectral change at sound transitions depends on the nature of the sounds involved; nasals and liquids are more similar to vowels than fricatives, for instance. A more detailed segmentation model based on spectral change also takes into account the nature of the sounds in the syllable rhyme (House 1995, 1996). This perceptual phenomenon explains why hearers are able to distinguish pitch movements occurring between adjacent syllables from those occurring within one and the same syllable.
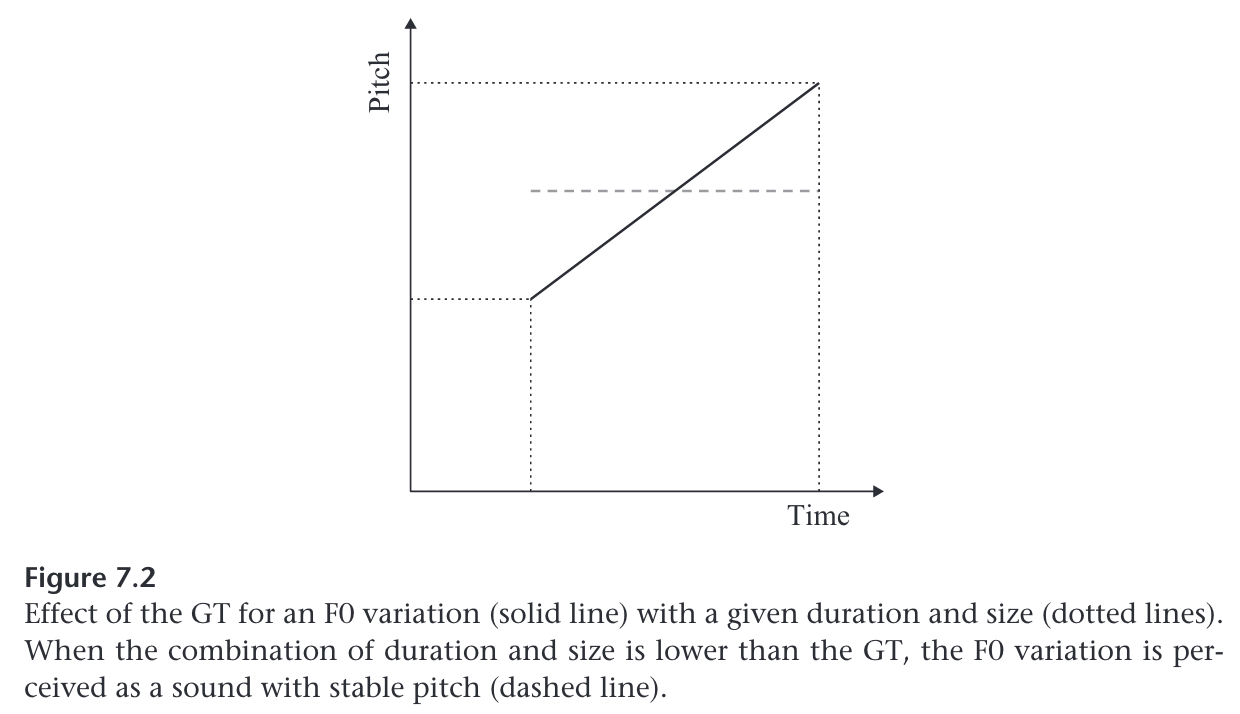
- Mertens p. 263-264 on glissando
Intrasyllabic pitch movement and the glissando threshold. Some syllables are perceived with a stable pitch, others with a changing pitch. In music, the latter type would be called a glissando. For a gliding pitch, the observed F0 change will exceed a threshold, which depends on the pitch interval covered by the glide and its duration (’t Hart, Collier, and Cohen 1990). Listening experiments with natural or synthetic speech (Rossi, 1971; Rossi et al. 1981; Mertens, Beaugendre, and d’Alessandro 1997) show that many intrasyllabic F0 variations observed in speech are indeed perceived. as glissandi. To decide whether a syllable is perceived with a stable or a gliding pitch, the combination of duration and size of the corresponding F0 variation is compared to the glissando threshold (GT), as illustrated for a uniform F0 change in figure 7.2. When they exceed the GT, a gliding pitch is obtained (solid line), otherwise a stable pitch is perceived with a frequency approaching the median F0 of the variation (dashed line).
The GT was first observed and measured in experimental settings, using stimuli with known properties, such as pure tones or synthetic vowels, presented repeatedly, separated by silence, hence followed by a pause. Natural, continuous speech is characterized instead by spectral instability due to sound concatenation and by the occasional presence of pauses. As a result, the threshold is higher in connected speech than for isolated sounds. House (1995) shows that the presence of the pause facilitates pitch perception—in other words, it lowers the GT. (For a detailed description of the measurement of the GT, see d’Alessandro and Mertens 1995, section 2.5.2.)